
Linear functions
- 강좌
- Algebra
- 문제 유형
- 일차함수
- 연습
- 전략 강의
- 언어
- 베트남어 · 영어
이 강의는 선택한 언어 버전이 아직 없어 영어 버전을 보여 줍니다.
1.1. General form of a linear equation
Terminology
| Linear equation | An equation of the form ax + b = c, where a, b, c are known numbers and x is the variable whose value we want to find. Example: 2x + 3 = 7, where a = 2, b = 3, c = 7 and x is the variable whose value we want to find. |
| Variable | A quantity that can change within a calculation or problem. Variables are usually denoted by letters such as x, y, z. Example: In the linear equation 2x + 8 = 7, the variable x represents the value we need to find. |
| Constant | Values that do not change within a calculation or math problem. Example: Suppose you want to find the area of a rectangle with length 4 and width 5. Here, 4 and 5 are two constants. |
| Coefficient | The number multiplied by the variable in an algebraic expression. Example: In 2x, 2 is the coefficient of the variable x. |
Formulas
y = f(x) = ax + b
Where:
a: the slope
b: the y-intercept
A function written as y = ax + b is said to be in slope-intercept form
What the coefficients mean
- The y-intercept b
Substitute x = 0 into the function:
y = f(0) = a ⨉ 0 + b = b
⇒ y = b is where the graph of y = f(x) crosses the y-axis ⇒ b is called the y-intercept
- The slope a:
Example: For the function y = f(x) = 2x + 3, we have the following table of values:
| x | y |
| 0 | 3 |
| 1 | 5 |
| 2 | 7 |
| 3 | 9 |
| 4 | 11 |
Each time x increases by 1 unit, y increases by 2 units. This is exactly the value of the slope a:
- x increases from 0 → 1, y increases from 3 → 5
- x increases from 1 → 2, y increases from 5 → 7
- x increases from 2 → 3, y increases from 7 → 9
- x increases from 3 → 4, y increases from 9 → 11
In general: the meaning of the slope a:
For the linear function y = f(x) = ax + b
⇒ f(x + 1) = a(x + 1) + b = ax + a + b = (ax + b) + a = f(x) + a
When x increases by 1 unit, y increases by a units ⇒ When x increases by n units, y increases by (a ⨉ n) units
⇒ This is the key sign that a function is linear
Formula for the slope a:

Where:
(x1,y1) and (x2,y2): two points that satisfy the equation of the function
 = y2 - y1 = the change in y
 = x2 - x1 = the change in x
- a > 0 ⇒ f(x) is an increasing function ⇒ the graph rises from left to right
- a < 0 ⇒ f(x) is a decreasing function ⇒ the graph falls from left to right
Applications
Problem: Tom is saving money to buy a new bicycle. He currently has $50 saved up and is saving $10 per week from his allowance. How much money will Tom have saved after 8 weeks?
Let x be the number of weeks that have passed and y be the amount of money Tom has saved
- Tom saves $10 every week
⇒ When x increases by 1 week, y increases by $10 ⇒ This is the sign of a linear function
⇒ Slope a = 10
- At the start (before any week has passed), Tom already has $50 saved
⇒ When x = 0, y = f(0) = 50 ⇒ y-intercept b = 50
Putting the two facts together ⇒ The linear function is y = 10x + 50
⇒ After 8 weeks, Tom will have saved f(8) = 10 ⨉ 8 + 50 = $130
1.2 Graph of a linear function
Terminology
| linear function | A linear function is a function of the form y = mx + b, where x is the variable, m is the slope and b is a constant. |
| slope, rate of change | A number that describes how steeply a line rises or falls. The greater the slope, the steeper the line. Example: In y = mx + 8, m is the slope, or rate of change, of the line. |
| constant | Values that do not change within a calculation or math problem. Example: Suppose you want to find the area of a rectangle with length 4 and width 5. Here, 4 and 5 are two constants. |
| variable | A quantity that can change within a calculation or problem. Variables are usually denoted by letters such as x, y, z. Example: In the linear equation 2x + 8 = 7, the variable x represents the value we need to find. |
| coefficient | A number multiplied by a variable. The coefficient is written in front of the variable and can be a positive or negative integer, a fraction or a decimal. Example: in 2x, 2 is the coefficient of the variable x. |
Applications
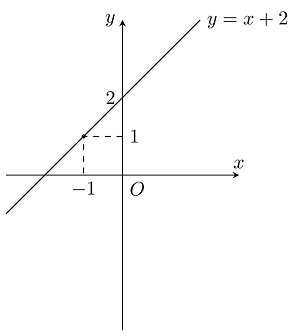
The graph of a linear function is a straight line.
To draw the graph of a linear function, you first need to identify 2 points that satisfy the function equation, then connect those 2 points.
For example: y = f(x) = x + 2
We see that the y-intercept b = 2 ⇒ The graph passes through the point (0,2)
To determine the second point, we can substitute x = -1 into the equation ⇒ f(-1) = -1 + 2 = 1
⇒ The graph passes through the point (-1,1)
1.3 Relationship between two lines
Terminology
| parallel | d1 // d2: the two lines are parallel and have no intersection point. |
| intersect | d1 intersects d2: the two lines cross at exactly one point. |
| perpendicular | d1 丄 d2 : the two lines intersect at exactly one point and form a 90-degree angle. |
| solution | A solution of an algebraic equation, given by a formula in the coefficients that uses only addition, subtraction, multiplication, division, integer powers and nth roots. |
Formulas
Let y = a1x + b1 and y = a2x + b2 be two linear functions whose graphs are the lines d1 and d2, respectively
Determining the relationship between these two lines on the coordinate plane means determining how many intersection points they have.
Setting the two y-values equal gives equation (1): a1x + b1 = a2x + b2
Formulas
d1 // d2 (parallel) ⇒ a1 = a2 and b1 ≠ b2
The two lines are parallel ⇒ No intersection point ⇒ Equation (1) has no solution
d1 intersects d2 ⇒ a1 ≠ a2
The two lines intersect ⇒ Exactly one intersection point ⇒ Equation (1) has exactly one solution
Special case: d1 丄 d2 ⇒ a1a2 = -1
d1 ☰ d2 ⇒ a1 = a2 and b1 = b2
The two lines coincide ⇒ Infinitely many intersection points ⇒ Equation (1) has infinitely many solutions
1.4 Linear inequalities
Terminology
| Linear inequality | An inequality of the form ax + b < c or ax + b > c, where a, b, c are known numbers and x is the variable whose value we want to find. Example: 2x + 3 < 7, where a = 2, b = 3, c = 7 and x is the variable whose value we want to find. |
| Variable | A quantity that can change within a calculation or problem. Variables are usually denoted by letters such as x, y, z. Example: In the linear equation 2x + 8 = 7, the variable x represents the value we need to find. |
| Constant | Values that do not change within a calculation or math problem. Example: Suppose you want to find the area of a rectangle with length 4 and width 5. Here, 4 and 5 are two constants. |
| Coefficient | The number multiplied by the variable in an algebraic expression. Example: In 2x, 2 is the coefficient of the variable x. |
Formulas
Method 1: 3 steps to graph a linear inequality
 |  |  |  | |
| Step 1 | Draw the line d, which is the graph of the function y = ax + b | |||
| Step 2 | Take the half-plane above line d | Take the half-plane below line d | ||
| Step 3 | Do not include line d ⇒ use a dashed line | Include line d ⇒ use a solid line | Do not include line d ⇒ use a dashed line | Include line d ⇒ use a solid line |
Method 2: use Desmos
- Clue words for linear inequalities in word problems
| Symbol | Clue words |
| > | greater than |
| < | less than, fewer than |
 | greater than or equal to, at least |
 | less than or equal to, at most, budget |
Application
Sarah has a budget of $500 to spend on clothes. She wants to buy some jeans that cost $50 each and some t-shirts that cost $20 each. She wants to buy at least 5 items in total.
Let the number of pairs of jeans Sarah buys be j and the number of t-shirts Sarah buys be t
- The total amount of money Sarah has is $500 ⇒ 50j + 20t 500
- Sarah wants to buy at least 5 items ⇒ j + t 5